A future blog post about using AI tools in production is coming up soon, but in the meantime building apps to solve everyday problems continues in my post-production video creation creative world. I’m the storage, workflow, backups, Mac management, techno healer. My clients are the creatives. They make cool stuff, so we have to safeguard it.
And while I don’t archive often, when I do, I use Archiware P5 🤩
And yes, that’s a joke because my clients backup and archive everyday and restore just as much. So keeping the P5 servers healthy is my job. And to help with this I made a P5 Health Check menu bar app (as well as mac app and bash script). To check drive cleaning status and uptime and a few things. In case anyone wants to be alerted of these things in the Menu bar. I know I want to know.
And for the fancy new Media List restore feature in P5 v.8 (which is very useful!) I created a FCPXMLD to FCPXML converter because the File -> Export menu in Final Cut Pro will give you a directory with XML inside of it, but I wanted to find those and rename them for use in P5 Archive, So yeah another app. Useful tools I use, my clients use, and now you can too.
Managing a fleet of macOS devices through SimpleMDM often requires constant vigilance over security updates, encryption status, and OS versions. What started as a practical shell script for checking device security status evolved into a full-featured native macOS application. This is the cold/flu season inspired adventure of a crazy idea that a simple shell script could become a Swift app and live in the Mac App Store.
With enough help from friends and current AI tools those fever dreams can become real. Join us on a long detailed rant from a 278-line Bash script to a modern SwiftUI app with secure credential management, intelligent caching, and a semi-decent and mostly functional user interface.
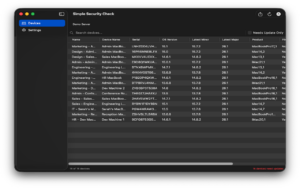
Simple Security Check app with test data
The Beginning: A Shell Script Solution
The original tool was born from a simple need: cross-reference SimpleMDM device data against the SOFA (Simple Organized Feed for Apple Software Updates) macOS security feed to identify which devices needed macOS updates. The shell script was straightforward but capable enough to export a spreadsheet for clients to review in a simple presentation:
```bash

#!/usr/bin/env bash

set -euo pipefail


# Fetch devices from SimpleMDM

# Compare against SOFA feed

# Export CSV reports

```
What the Shell Script Did Well
The shell script handled several complex tasks more or less efficiently:
1. **API Pagination**: Properly implemented cursor-based pagination for SimpleMDM’s API, handling potentially thousands of devices across multiple pages with retry logic and exponential backoff. Note: the very first version I posted didn’t do this at all, but thanks to a reminder from a helpful MacAdmin I remembered I needed to implement pagination and do it properly. Thanks!
2. **Smart Caching**: Cached both SimpleMDM device lists and SOFA feed data for 24 hours, reducing API calls and improving performance.
3. **Comprehensive Security Tracking**: Monitored FileVault encryption, System Integrity Protection (SIP), firewall status, and OS version compliance.
4. **Flexible Exports**: Generated three types of CSV reports and full JSON exports with timestamps, automatically opening them in the default applications.
5. **Version Intelligence**: Compared devices against both their current major OS version’s latest release and the maximum compatible OS version for their hardware model.
The Pain Points
However, the shell script approach had limitations:
– **API Key Management**: The API key had to be entered each time or set as an environment variable—no secure storage mechanism.
– **Single Account**: No support for managing multiple SimpleMDM accounts or environments.
– **Limited Search**: Finding specific devices required opening CSVs and using spreadsheet search.
– **No Visual Interface**: Everything was command-line based, requiring users comfortable with terminal operations.
– **Manual Execution**: I had to remember to run it periodically.
The script even had a TODO comment acknowledging its destiny:
```bash

# to do: make into a native swift/swiftUI app for macOS

# with better UX saving multiple API key entries into

# the keychain with a regular alias
“`
The Transformation: Building a Native macOS App
The decision to create a native macOS application wasn’t about abandoning what worked—it was about preserving that core functionality while addressing its limitations. And most importantly, being nerd-sniped by a colleague saying why not make it into a Swift app using current AI tools. I thought I could try it. How hard could it be? haha. What do I know about Swift, and what do I know about what is possible? Let’s see. The goal was clear: maintain 100% feature parity with the shell script while adding the convenience users expect from modern macOS software. And simplicity. I wanted a simple app to use to make all our lives easier. At least, this one part.
Architecture Decisions
The app was built using SwiftUI with a clear separation of concerns:
**AppState.swift** – The Brain
```swift

@MainActor

class AppState: ObservableObject {

    @Published var apiKeys: [APIKeyEntry] = []

    @Published var devices: [SimpleMDMDevice] = []

    @Published var sofaFeed: SOFAFeed?

    @Published var searchText = ""

    @Published var showOnlyNeedingUpdate = false

}

```
This centralized state manager coordinates all data operations, making the UI reactive and keeping business logic separate from presentation.
**KeychainManager.swift** - Secure Storage

```swift

class KeychainManager {

    func saveAPIKey(_ key: String, for alias: String) throws {

        // Store in macOS Keychain with kSecAttrAccessibleWhenUnlocked

    }

}

```
One of the shell script’s biggest weaknesses became one of the app’s strongest features. API keys are now stored securely in macOS Keychain, never exposed in plain text, and protected by the system’s security model.
**DatabaseManager.swift** - Intelligent Caching

```swift

class DatabaseManager {

    func getCachedDevices(forAPIKey alias: String) -> [SimpleMDMDevice]? {

        // Query SQLite with 24-hour cache validation

        // Indexed for fast search

    }

}

```
The file-based JSON caching from the shell script evolved into a SQLite database with indexed search capabilities. Each API key gets its own cached dataset, and the 24-hour cache duration from the original script was preserved.
**APIService.swift** - Network Layer

```swift

class APIService {

    func fetchAllDevices(apiKey: String,

                        apiKeyAlias: String,

                        forceRefresh: Bool) async throws -> [SimpleMDMDevice] {

        // Same pagination logic as shell script

        // Same retry mechanism with exponential backoff

        // Same User-Agent header pattern

    }

}
“`
The API fetching logic was ported almost line-for-line from the shell script. The same pagination handling, the same retry logic, even the same User-Agent pattern. If it worked in Bash, it works in Swift. And the User-Agent pattern came from a helpful Issue submitted in GitHub about making the shell script a better part of the SOFA ecosystem. Thanks again!
What Got Better
**Multiple API Key Support**
The single biggest improvement was supporting multiple SimpleMDM accounts. IT administrators often manage multiple clients or environments. The app now stores unlimited API keys with custom aliases:
– “Production” for your main environment
– “Testing” for sandbox testing
– “ClientA“, “ClientB” for MSPs managing multiple organizations
Each API key appears as a tab in the interface, with separately cached data for instant switching.
**Real-Time Search and Filtering**
The shell script required exporting to CSV and searching in a spreadsheet. The app provides instant, full-text search across all device attributes:
```swift

var filteredDevices: [SimpleMDMDevice] {

    var result = devices


    if showOnlyNeedingUpdate {

        result = result.filter { $0.needsUpdate }

    }


    if !searchText.isEmpty {

        result = result.filter { device in

            name.localizedCaseInsensitiveContains(searchText) ||

            deviceName.localizedCaseInsensitiveContains(searchText) ||

            serial.localizedCaseInsensitiveContains(searchText) ||

            // ... and more fields

        }

    }


    return result

}

```
Type a serial number, see the device instantly. Toggle “NeedsUpdate” to focus on out-of-date machines. Sort by most columns with a click. Note: I did run into a limitation with the number of sortable columns in the Swift code, many iterations and trials and eventually I found something that worked. Yeah Swift!
**Automatic Refresh with Progress**
The shell script required manual execution. The app handles refresh automatically:
– Background refresh respects the 24-hour cache
– Progress indicators show API fetch status
– Force refresh option bypasses cache when needed
– Errors display in-app with clear messaging
What Stayed the Same (Intentionally)
Certain aspects of the shell script were functional and useful so they were copied in the app:
**Export Format Compatibility**
The CSV exports use the exact same format as the shell script:
The 24-hour cache validity period was retained. It’s a sensible balance between API rate limiting and data freshness for device management.
**SOFA Integration Logic**
The algorithm for matching devices against SOFA feed data remained identical:
1. Build a lookup table of latest OS versions by major version
2. Match each device’s hardware model against SOFA’s compatibility data
3. Determine both “latest for current major” and “latest compatible overall”
This dual-version approach is valuable for planning: devices might be current on macOS 13.x but capable of running macOS 15 or macOS 26. It’s good to know.
Technical Highlights
Security Model
The app runs fully sandboxed with carefully scoped entitlements:
API keys use Keychain with `kSecAttrAccessibleWhenUnlocked`, meaning they’re protected when the Mac is locked.
Data Flow
1. **Launch**: Load API key metadata from UserDefaults, actual keys from Keychain
2. **Refresh**: Check SQLite cache validity, fetch from APIs if needed
3. **Process**: Merge SimpleMDM and SOFA data using the same algorithm as the shell script
4. **Cache**: Store in SQLite with timestamp and API key association
5. **Display**: Render in SwiftUI Table with reactive filtering
Test Mode Feature
A unique addition not in the shell script: a test mode that generates dummy devices for demonstrations and screenshots:
```swift

func toggleTestMode() {

    testModeEnabled.toggle()


    if testModeEnabled {

        let demoEntry = DummyDataGenerator.createDemoAPIKeyEntry()

        apiKeys.insert(demoEntry, at: 0)


        let dummyDevices = DummyDataGenerator.generateDummyDevices(count: 15)

        // ... process with real SOFA data

    }

}

```
This allows testing the full UI without a SimpleMDM account—perfect for App Store screenshots or demos. And it turns out a requirement for the App Store review process since the alternative was giving them API keys to real data to test with, which I could not do, of course, and which brought us to generating test data. A perfect plan.
Lessons Learned
What Worked
**Preserve the Core Logic**: The shell script’s API handling, caching strategy, and data processing were good enough and worked. Porting them to Swift rather than redesigning saved time and avoided regressions.
**Prioritize Security from Day One**: Building Keychain integration first made everything else easier. API keys are sensitive, and getting that right early prevented technical debt.
**SwiftUI for Rapid UI Development**: Building the table view, settings panel, and navigation in SwiftUI was dramatically faster than AppKit would have been. But since my experience was using an app like Platypus for simple app creation using SwiftUI was definitely more flexible and possible with help from current tools.
What Was Challenging
**Async/Await Migration**: The shell script’s sequential curl calls had to become proper async Swift code with structured concurrency.
**SQLite in Swift**: While more powerful than file caching, setting up proper SQLite bindings and schema management added complexity. and app sandbox rules moved the location of the cache and added a wrinkle in testing.
**Tab-Based Multi-Account UI**: The shell script only handled one API key. Designing an intuitive interface for switching between multiple accounts required several iterations.
– **One account to many**: Support for unlimited SimpleMDM accounts. Good for testing.
– **Terminal to GUI**: From command-line to native macOS interface
The app isn’t just a shell script wrapped in a window—it’s a giant leap into Swift app production which challenged me enormously for troubleshooting and app testing. This app is a small step in the code adventures that await us all when we want to take an idea, from shell code to Mac app.
Future Enhancements
While the current version achieves feature parity and then some, there’s room to grow:
– **Scheduled Auto-Refresh**: Background fetching on a schedule
– **Push Notifications**: Alerts when devices fall out of compliance
– **Export Automation**: Scheduled exports to specific directories
– **Custom Filters**: Save filter configurations for different report types
– **Device Groups**: Tag and organize devices into custom categories
– **Trend Analysis**: Historical tracking of fleet compliance over time
This is not the end
The journey from shell script to native app demonstrates that nerd-sniping does work and we can be pushed to try new things. The shell script’s core logic—its API handling, caching strategy, and data processing—was already ok, somewhat decent, and at least functional. The leap to all Swift was about making that functionality more accessible, more secure, while making testing and troubleshooting more difficult and confusing, but also a valuable learning opportunity. Xcode 26.1 has some basic code fixing abilities that we tested many times. It helped!
For IT administrators managing Mac fleets, the app delivers what the script did (device security monitoring and reporting) with what the script couldn’t (multi-account support, instant search, secure credential storage, and a native interface).
The script’s final TODO comment has been fulfilled:
```bash

# to do: make into a native swift/swiftUI app for macOS

# with better UX saving multiple API key entries into

# the keychain with a regular alias

```
*Built with SwiftUI, powered by the same bad logic that served IT admins well in its shell script form, now with the wild woodland scent of a native macOS application.*
What if we wanted to know what is the current version of XProtect across the Mac fleet? and what if this wasn’t collected by default by MDM tool, in my case, SimpleMDM. Well, I can write a script to collect this info, for my purposes I’ve chosen to use silnite from Howard Oakley of eclectic light co fame and write the version number to a custom attribute. The next step is use SimpleMDM’s new dynamic groups (in preview, at the time of this blog post), and then I can watch the result filter in with a special group watching for “is matching this version” or the opposite “is not this version”. Just depends on what you want to act on or how you want to see the information. The new dynamic groups is the exciting part. I’m sooo excited.
The custom attribute
Screenshot
Setting up a custom attribute of “XProtectV: and a default value of “Version Unknown” should be done before the script runs. If I get the default result then the script didn’t run or some other reason.
The code
#!/bin/bash
LOG_DIR="/Users/Shared"
DATE=$(date +"%Y-%m-%d_%H-%M-%S")
LOG_FILE="$LOG_DIR/silcheck-log-$DATE.txt"
/usr/local/bin/silnite aj > "/Users/Shared/silnite-xprotectv-$DATE.json"
XPROTECTV=$(/usr/bin/plutil -extract XProtectV raw "/Users/Shared/silnite-xprotectv-$DATE.json")
echo "$XPROTECTV" | tee -a "$LOG_FILE"
The simple script writes a log into /Users/Shared just because I want to and uses the silnite binary to write out the XProtect info and plutil to extract the info from the jsonNote: you could also use jq in latest macOS 15 but this way is more compatible across macOS versions for now. The XProtect version is saved as an attribute which SimpleMDM picks up and reports back to base.
The dynamic group
Screenshot
The filter headings are a little cut off in the screenshot but it basically says choose from all devices, refer to the custom attribute I set of XprotectV and makes sure the value equals the latest (at blog post writing) 5297 and further filter results for devices last seen in the last day. If I had switched it to the not equal to version 5297 I would see all the devices not up to date. And it’s easy to change on the fly. Easier than refreshing the main device dashboard page to see these results as I was trying to do previously and that method made it hard to further filter.
The exciting part
Yes the best part is to set up a job in SimpleMDM that runs the scripts on the devices to refresh the value of XProtect (I have it set to recurring as well) and then watch the results roll into a dynamic group which has its members populate as the scripts runs and results report back. Easey peasy.
Screenshot
Addendum:
Adding an example screenshot to show how you can change the filter from matches an exact value of XProtect, in this example, to “not equal to” to see all the devices that haven’t upgraded yet. It’s as easy as changing the filter and clicking on “staging filter changes” button. Et voilà !
macOS 15 Sequoia. Check your firewall checking scripts please
If anyone is following along with my attempt to re-create MunkiReport in SimpleMDM then you’ll be happy to know the space madness is still strong and macOS 15 has made one tiny thing break, my firewall checking script.
My firewall checking script began life as a simple check of the status in the alf pref file but that file no longer exists in macOS 15.
See this Knowledge base article which lists in bug fixes that the file no longer exists and that the socketfilterfw binary be used instead, except that doesn’t work when Macs are managed.
Application Firewall settings are no longer contained in a property list. If your app or workflow relies on changing Application Firewall settings by modifying /Library/Preferences/com.apple.alf.plist, then you need to make changes to use the socketfilterfw command line tool instead.
Yes, my Macs are managed with MDM and yes I have a profile to enable the firewall but no I don’t trust it so can I check please with another method. Trust but verify.
So thanks to some friends in the MacAdmins Slack I stole the idea from tuxudo to check firewall in macOS 15 using system profiler, because he had re-written the MunkiReport module already and so there I go again, stealing from MunkiReport and all the hard work they do.
After playing with the output of system_profiler a bit I looked at the “Mode”
/usr/sbin/system_profiler SPFirewallDataType -detailLevel basic |grep Mode
      Mode: Allow all incoming connections
      Stealth Mode: No
Of course I could write some nice code to clean this up or instead I switched to searching for “Limit” and if there’s no hit on that there’s no limit (translated: firewall is not enabled“)
And if there is a limit then the firewall is enabled.
Mode: Limit incoming connections to specific services and applications
Simple. Good enough to add to my SimpleMDM script to run and populate the value to the custom attribute and update my dashboard. And my crazy mission to build everything into SimpleMDM dashboard is still… madness …. but also quite fun.
I was chatting with Per Olofsson on a recent episode of the MacDevOps podcast about some recent fixes with relocatable Python he did for MunkiReport version 5.7.0 and I happened to mention how much I love my MR dashboards with custom hot keys. He is a long time user of MunkiReport but hadn’t heard that you could make custom dashboards and I couldn’t remember where I had heard of it or even how I made them. Pretty typical of tech these days I think. You learn something, you make something and then you move to the next thing and forget what you were doing or how you did it. Well, thanks to documentation we can share the knowledge and spread the love.
Custom Dashboards
The MunkiReport wiki actually has a short entry which explains how to make a custom Dashboards. Basically, add some YAML files in the dashboards folders and you’re done. Follow the Read Me file for instructions. Pro Tip: Use the Widget Gallery in MR to find useful pieces to build into your dashboards. Note: I’ve added these custom dashboards to my local folder which is set in my “.env” to be outside of the main munkireport folder so it easier to update across version upgrades.
I’ve been a little busy lately. I’m working on some scripts for Watchman Monitoring that alert when Archiware P5 needs attention. It’s really much more exciting than it sounds. 🙂
UPDATE: The Archiware P5 plugin is now included with the Watchman Monitoring client version 6.6.0
Use the link above to read up about Watchman Monitoring and the Archiware P5 plugin.
This plugin is now part of Watchman Monitoring thanks to Allen and his team! Of course, big thanks to a lot of help from Python magician and MacDevOps:YVR colleague, Wade Robson. I couldn’t have finished this plugin without his help. Merci, mon ami. (Early help to get started with this project is thanks to Scott Neal, automation expert and programming wizard. Thank you so much Scott, and thanks for the tasty Portland beer!).
Watchman Monitoring is a group of plugins that will warn when drives are failing, computers have restarted unexpectedly or backups are not running. All reporting goes to a beautiful web interface in the cloud which can keep a history of plugin issues. Watchman allows for integration with ticket systems and multiple users including clients and IT staff that can keep track of what’s up with their workstations, and servers.
Watchman Monitoring helps me keep tabs of major issues at all my clients before they become disasters. I even use it in discovery for new clients to see what issues exist but are ignored or unknown.
Since I set up a lot of SAN storage for my clients, and I use Archiware P5 for backups and archives I realized I needed to write a plugin for Watchman Monitoring that alerts me to issues. Instead of remoting in with VPN to each and every client every day to check on backups the only alternative is to automate it. These scripts watch the LTO tape drives and emails when they need cleaning, or warns when running jobs need tapes, if workstations haven’t backed up in a while or if tape pools need more tapes. And in Beta 2 we’ve added a check to see if the P5 maintenance support needs to be renewed to give you time to renew it before it expires. As well as better alerts for issues with running jobs, and lots of bug fixes.
We have it working on Mac servers running Archiware P5 and the next step is Linux, and the Unix family. Later on, Watchman will port it to Windows. The scripts are written in Python which is great for portability (except to Windows. Ha ha). And the P5 Watchman plugins should eventually run everywhere that Archiware P5 runs (OS X, Linux, FreeBSD, Solaris and Windows).
The best part of writing plugins for Watchman Monitoring is the great help that Allen and the whole team at Watchman have given us been throughout our development of these Archiware P5 plugins. And of course everyone at Archiware and Mike at PVT have been super helpful in explaining the use of the nsdchat cli for Archiware P5, even going so far as to add some features we needed to nsdchat when we explained how useful they’d be for this project. Mille mercis. Vielen danke.
Using GitHub to check code in, document business logic, write code, build a wiki and then track issues that need bug fixes or enhancement requests has been an adventure. It all starts with an problem that you want to be alerted for. It’s easy enough to add custom plugins to Watchman Monitoring you just need some ideas, a programmer (or two) and some time for testing, debugging, more testing and time. Did I mention you need lots of time? Ha ha
And now for a sneak peak of the Archiware P5 beta 2 plugins for Watchman Monitoring.
Watchman nicely lists the new warnings and expirations for quickly getting to the issues you need to see.
Expirations are tracked with Watchman. In this case we note the date when the maintenance for Archiware P5 needs to be renewed. Don’t want to miss that!
Server info is good to know. Uptime, port used, and what exactly is licensed.
The LTO tape drive is the heart of any tape library, and alerting when it needs cleaning is very important.
Other plugins watch the tape pools, running and completed jobs, as well as Backup2Go (workstation backup).